Visualise Subjects Enrollment
Site subject enrollment plot is useful tool for tracking recruitment performance of particular study site. It also can help to spot errors related to wrongly assigned study subject enrollment dates and similar. The plot gets displayed when clicking on Enrollment option withing the Subjects tab of Subjects/Events/CRFs view, Fig. 14, and can be exported/downloaded.
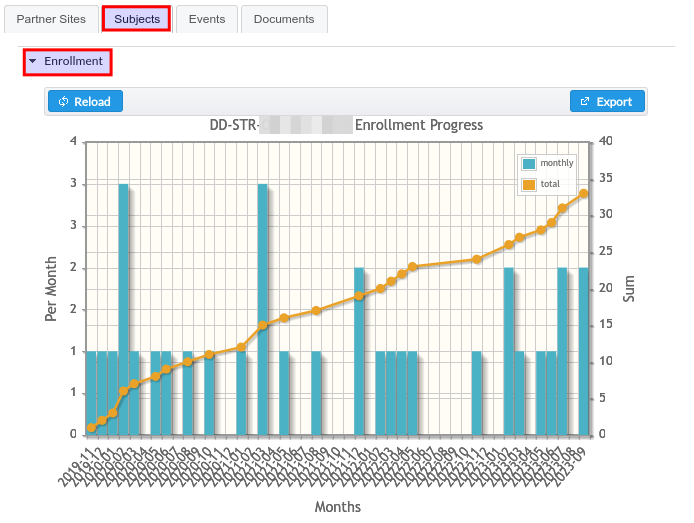
Fig. 14 EDC module study site enrollment plot.
Note
For more advance visualisation of study data it is recommended to utilise LAB component and its R reporting capabilities.